How Does Changing One Data Value Affect the Variance?
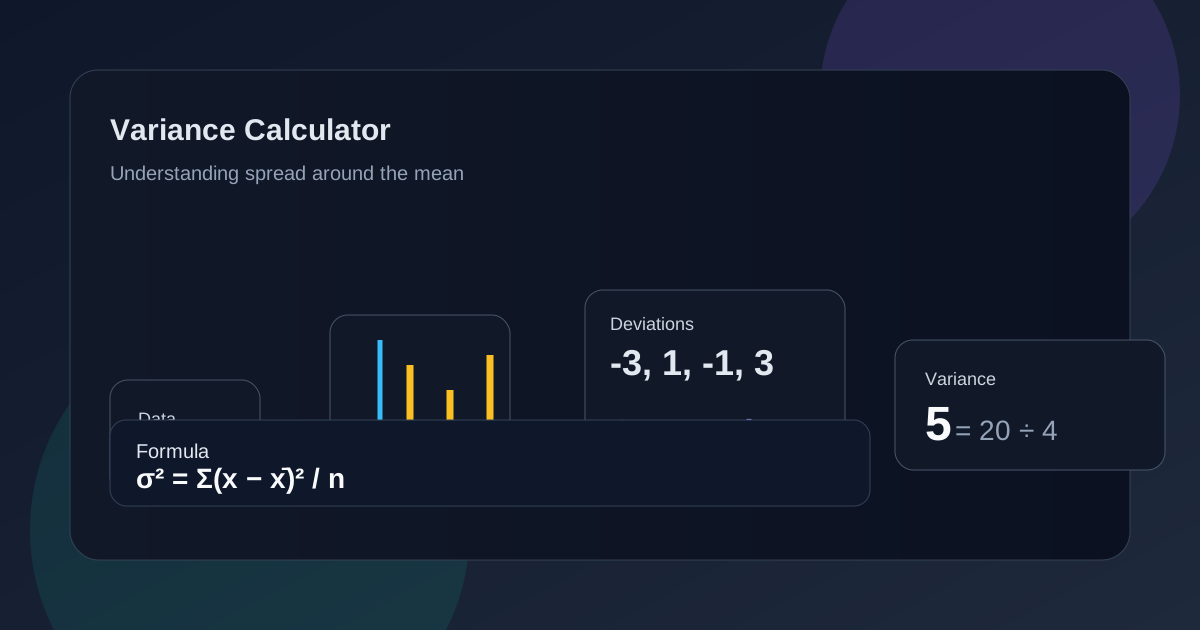
Swap out a single number in your dataset, and suddenly your entire variance calculation shifts, sometimes dramatically, sometimes barely at all. This sensitivity isn’t random; it follows predictable patterns based on exactly where that changed value sits relative to the mean. Understanding how changing one data value affects variance reveals something genuinely important about why outlier detection matters so much in statistics, and why a single unusual measurement can quietly distort an entire analysis.
What Happens to Variance When One Observation Moves Away From the Mean?
As a single value shifts farther from the arithmetic mean, its squared deviation grows disproportionately, since squaring amplifies larger distances far more than smaller ones.
This means even a modest shift in one observation can produce a noticeably larger overall variance, especially when the original dataset was relatively small to begin with.
How Can Replacing One Value Change the Overall Data Spread?
Swapping a single number for a dramatically different one immediately alters both the mean and every subsequent squared deviation calculated from that new average.
This ripple effect means replacing values doesn’t just change one term in the calculation; it changes the entire baseline every other deviation gets measured against.
Why Can a Single Extreme Value Have a Large Effect on Variance?
An outlier effect occurs precisely because squaring amplifies distance disproportionately, turning one unusual number into a squared contribution that can dwarf every other value combined.
This sensitivity explains why statisticians often flag and investigate outliers before trusting a variance calculation, since one unusual entry can misrepresent the entire dataset’s actual consistency.
What Happens When One Data Point Moves Closer to the Mean?
Conversely, shifting a value toward the mean change reduces its squared deviation, generally pulling overall variance downward since that term now contributes less to the total sum.
| Scenario | Effect on Variance |
|---|---|
| Value moves away from mean | Variance increases |
| Value moves toward mean | Variance decreases |
How Does Adding a New Observation Change Existing Variance?
Adding observations recalculates both the mean and every squared deviation from scratch, meaning even a typical, unremarkable new value still shifts the final variance somewhat.
Whether variance increases or decreases depends entirely on where that new observation falls relative to the newly recalculated mean, not simply its raw value alone.
Can Removing One Extreme Value Dramatically Reduce Variance?
Yes, removing observations that sit far from the mean often produces a noticeably smaller variance, since that single term was likely contributing disproportionately to the original total.
This dramatic reduction after removing one outlier is exactly why examining variance before and after excluding suspicious values helps confirm whether that point genuinely distorted your results.
How Does the Position of a Data Value Affect Its Squared Deviation?
A value’s squared deviation depends entirely on its distance from the mean, meaning identical raw values can contribute very differently depending on which dataset they belong to.
This position-dependent contribution explains why the same number, say 50, might barely affect variance in one dataset while dramatically inflating it in another with a very different average.
Why Does Changing One Number Also Change the Mean?
Since the arithmetic mean depends on every value in the dataset, altering even one number necessarily shifts that average, which then cascades into every subsequent deviation calculation.
This interconnection means you can’t isolate the effect of one changed value without also recalculating the mean and every other squared deviation from that updated baseline.
How Can You Calculate the New Variance After Editing a Dataset?
Recalculate the entire variance from scratch after any edit: find the new mean, recompute every deviation, square them, and average the results using the updated dataset.
Shortcuts exist for large datasets with minor edits, but for smaller datasets, a full recalculation remains the safest way to confirm your updated variance is accurate.
What Does This Tell You About the Sensitivity of Variance?
This entire exploration reveals that variance sensitivity to individual values, particularly outliers, is a fundamental characteristic of the measure, not a flaw or calculation quirk.
Understanding this sensitivity helps explain why researchers often examine data carefully for unusual values before trusting variance as an accurate representation of typical spread.
Conclusion
Changing a single data value ripples through the entire variance calculation, shifting both the mean and every squared deviation calculated from it. This sensitivity, especially pronounced for values far from the mean, explains why outliers deserve careful scrutiny before you trust any calculated measure of data variability.