How to Calculate Population Variance vs. Sample Variance Without Confusion
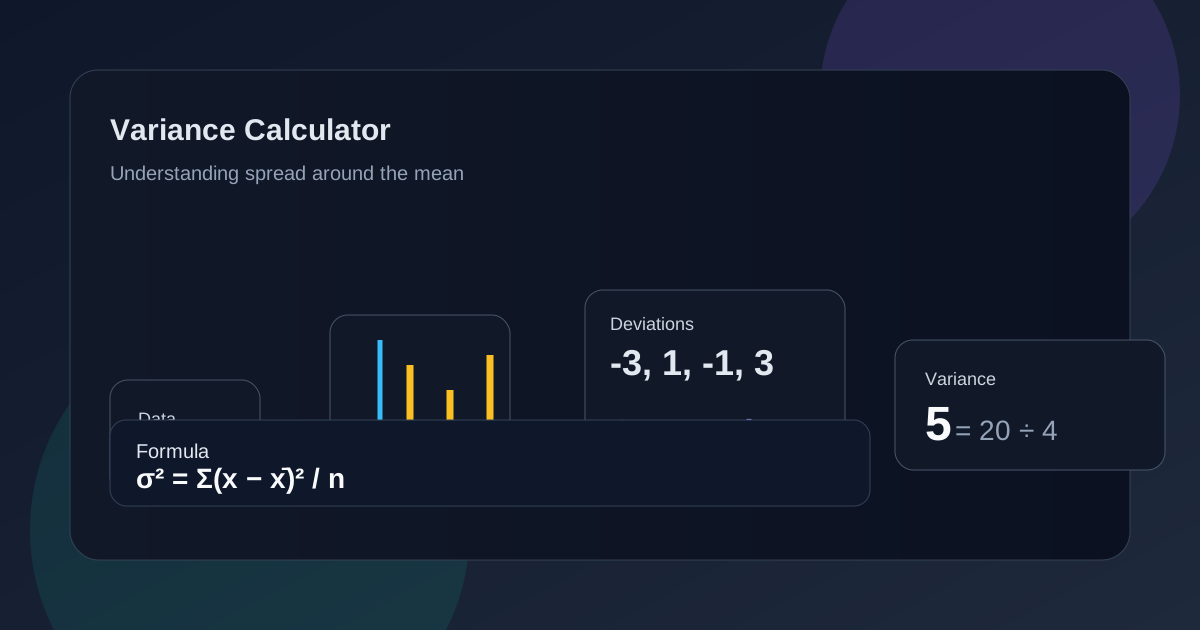
Two nearly identical formulas, one small difference in the denominator, and suddenly your calculated result changes just enough to matter. The distinction between population variance and sample variance trips up students and professionals alike, not because the math is hard, but because knowing which formula applies requires understanding what your data actually represents. This guide clears up exactly when to use each one and why that single denominator difference genuinely matters.
What Is the Main Difference Between Population and Sample Variance?
Population variance divides squared deviations by the total number of observations, while sample variance divides by one less than that count, a deliberate mathematical adjustment.
This seemingly small difference exists because samples systematically underestimate true population variability, requiring this correction to produce a more accurate estimate.
When Should You Use the Population Variance Formula?
Use the population variance formula only when your dataset represents every single member of the group you’re studying, with no missing individuals excluded from your calculation.
A complete census, every student in one specific classroom, or every product manufactured in a single defined batch all qualify as genuine population data scenarios.
When Is the Sample Variance Formula More Appropriate?
Choose sample variance whenever your data represents only a subset drawn from a larger group, which describes the vast majority of real-world research and data collection scenarios.
Surveys, experiments, and most practical statistical sample situations require this formula, since collecting data from every possible member of a population rarely proves feasible.
Why Does Sample Variance Use n − 1 Instead of n?
Dividing by n minus one rather than n corrects for the tendency of samples to underestimate true population variability, producing what statisticians call an unbiased estimator.
Without this adjustment, sample variance would systematically produce results smaller than the true population value, introducing consistent, predictable bias into every calculation.
How Do You Identify Whether Your Data Represents a Population or Sample?
Ask directly whether your data includes every possible member of the group you care about, or only a portion drawn from that larger, complete group.
If any relevant individuals were excluded or unavailable for measurement, you’re working with sample data, requiring the adjusted n-minus-one denominator in your calculation.
How Can the Same Dataset Produce Different Sample and Population Variances?
| Formula | Denominator | Result Tendency |
|---|---|---|
| Population | n | Smaller value |
| Sample | n − 1 | Slightly larger value |
Applying both formulas to identical raw numbers produces genuinely different results, since the variance denominator itself changes between the two approaches.
What Do σ² and s² Mean in Variance Calculations?
σ squared, using the Greek letter sigma, represents population variance, while s squared specifically denotes sample variance, providing clear notational distinction between the two concepts.
Recognizing these symbols immediately clarifies which formula a particular textbook, paper, or calculation is actually referencing without needing additional context.
How Does Sample Variance Estimate Population Variability?
Sample variance serves as a practical, unbiased estimate of the true underlying population variance, acknowledging that we rarely have access to complete population data in practice.
This estimation function explains why the n-minus-one adjustment matters so much: it specifically corrects for the systematic underestimation that would otherwise occur without it.
What Mistakes Commonly Happen When Choosing the Wrong Formula?
Using the population variance formula on sample data produces a result that’s slightly too small, understating the true variability present in the broader population being studied.
This common mistake often goes unnoticed since both formulas produce similar results for large datasets, though the discrepancy grows more noticeable with smaller sample sizes.
How Can a Calculator Help You Select the Correct Variance Method?
A variance calculator offering both formula options lets you confirm your result matches expectations, while explicitly forcing the choice between population and sample calculation methods.
This explicit choice prevents the common mistake of defaulting to one formula without actually considering whether your data represents a complete population or merely a statistical sample.
Conclusion
Choosing between population variance and sample variance comes down to one question: does your data include every member of the group, or just a subset? Getting this distinction right, and applying the correct denominator accordingly, ensures your calculated variance genuinely reflects the variability you’re trying to measure.