What Does Variance Actually Tell You About Your Data?
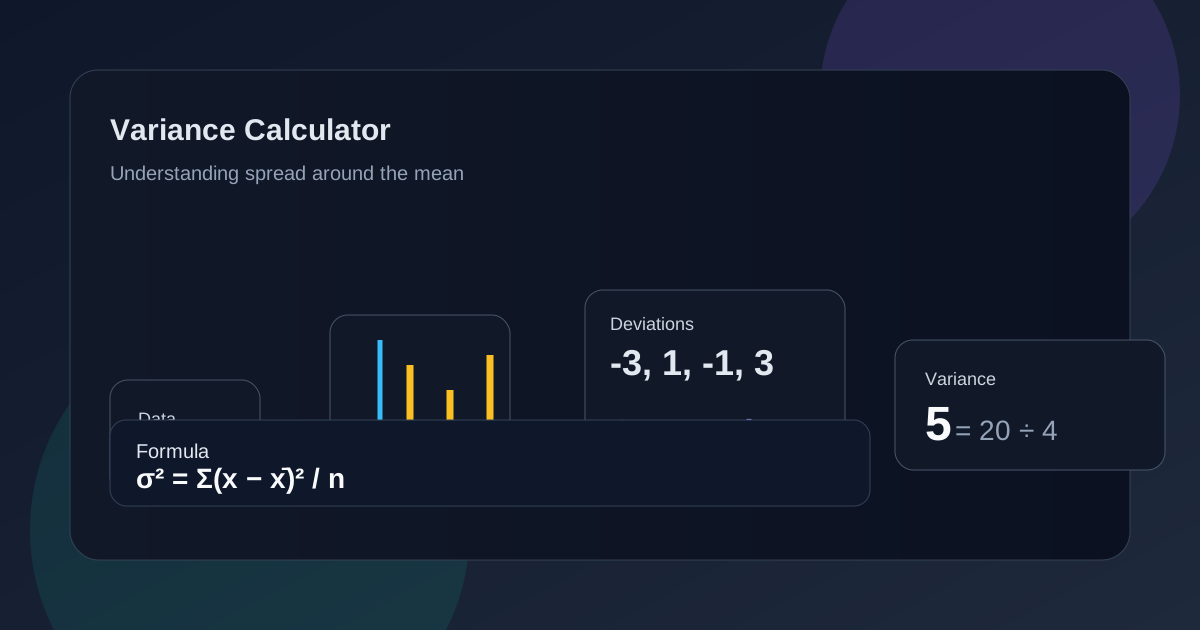
A number sitting on a page means nothing until you understand what it’s actually describing. Variance is exactly this kind of number, calculated easily enough, but genuinely useful only once you grasp what a small or large result actually reveals about your underlying data. This guide moves past the formula itself and focuses entirely on interpretation, helping you read a variance value the way a statistician actually would.
How Does Variance Show Whether Data Values Are Closely Grouped?
Variance essentially measures how tightly or loosely individual values cluster around the mean, translating that spread into a single, comparable number.
A dataset where every value sits close to the average produces a small variance, while one containing widely scattered values produces a substantially larger result reflecting that data spread.
What Does a Small Variance Say About a Dataset?
Low variance suggests remarkable consistency, meaning most observations sit close to the mean without significant deviation in either direction throughout the entire dataset.
This consistency often signals a stable, predictable process, whether measuring manufacturing tolerances, test scores, or any other repeated measurement showing minimal data variability.
What Does a Large Variance Reveal About Data Spread?
High variance indicates the opposite scenario: values scattered widely across a broad range, suggesting genuine inconsistency or unpredictability within whatever generated that data.
This spread might reflect natural diversity, measurement error, or genuinely inconsistent underlying conditions, each requiring different follow-up investigation depending on the actual statistical dispersion context.
Can Two Datasets Have the Same Mean but Different Variances?
Absolutely. Two datasets can share an identical average while looking completely different in terms of actual spread, since the mean alone captures nothing about dataset consistency.
This exact scenario demonstrates why reporting variance alongside the mean provides genuinely richer insight than either statistical measure could offer independently.
How Does Variance Help Compare the Consistency of Different Datasets?
Comparing variance values directly between two datasets reveals which one demonstrates more consistent behavior, assuming both measurements use the same underlying units for fair comparison.
This variance comparison proves particularly valuable in quality control, research, or any context where consistency itself matters as much as the average outcome.
Why Is Variance More Informative When Viewed Alongside the Mean?
Variance alone tells you about spread, but pairing it with the mean provides complete context, since identical variance values mean different things depending on the scale of the original data distribution.
A variance of 10 means something very different for data averaging around 5 compared to data averaging around 1000, making this combined interpretation essential.
What Does Zero Variance Mean for a Dataset?
Zero variance occurs only when every single value in a dataset is identical, meaning no spread exists whatsoever around the calculated mean.
This extreme scenario rarely appears in real-world data analysis, since natural variation almost always produces at least some minimal spread among genuine measurements.
How Do Extreme Values Influence the Variance?
Extreme values, sitting far from the mean, disproportionately inflate variance because squaring amplifies larger deviations far more than smaller ones within the same calculation.
Even a single unusual observation can noticeably shift overall variance interpretation, which is why examining individual data points matters before drawing conclusions from the number alone.
Why Does the Unit of Variance Differ From the Original Data?
Since variance involves squaring deviations, its resulting squared units differ from the original measurement scale, making direct interpretation slightly less intuitive than the mean itself.
This unit mismatch is exactly why standard deviation, which reverses the squaring through a square root, often gets reported alongside or instead of raw variance for easier interpretation.
How Can Variance Help You Understand Patterns in Real-World Data?
Beyond abstract statistics, variance helps identify genuine patterns, like whether a manufacturing process stays consistent or whether customer satisfaction scores vary wildly across different locations.
Applying this variability analysis to real situations transforms an abstract number into a genuinely actionable insight about consistency, reliability, or predictability within whatever you’re measuring.
Conclusion
Variance tells a story about consistency that the mean simply cannot capture on its own. Small values suggest tight clustering, while larger ones reveal genuine spread, and understanding this distinction turns a raw calculation into meaningful, actionable insight about your dataset spread.