Why Is Your Variance So Large? Understanding What the Number Really Means
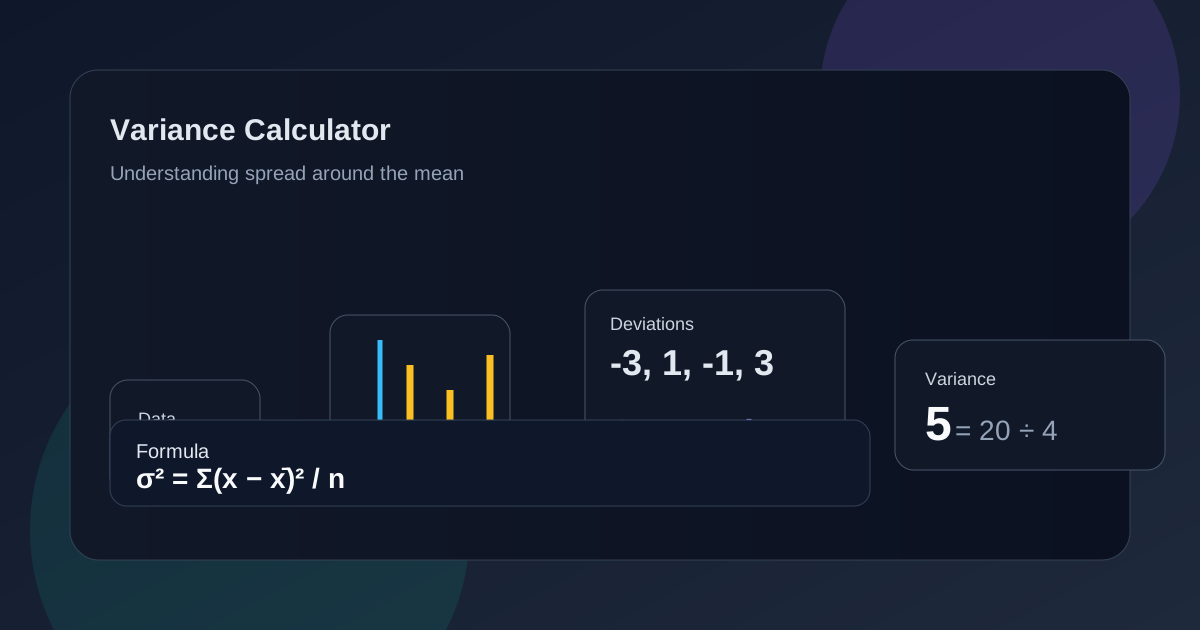
You ran the calculation twice, checked your arithmetic, and the number still looks alarmingly big. Before assuming you made a mistake, it’s worth understanding that large variance often reflects something genuinely happening within your data, not necessarily a calculation error at all. This guide walks through the actual causes behind an unexpectedly high result and how to investigate it properly.
What Can Cause a Dataset to Have a Very Large Variance?
Several factors drive large variance, including genuinely inconsistent underlying data, the presence of extreme outliers, or naturally occurring distinct subgroups mixed together within one dataset.
Before assuming an error occurred, examine your raw values directly, since a legitimately wide data range often explains a large result without any calculation mistake involved.
How Do Extreme Values Increase the Variance?
Extreme values sitting far from the mean produce disproportionately large squared deviations, since the squaring step amplifies bigger differences far more aggressively than smaller ones.
Even a single unusually distant observation can meaningfully inflate overall variance, regardless of how consistent the remaining majority of your data actually looks.
Why Do Outliers Have Such a Strong Effect on Variance?
Outliers exert outsized influence precisely because of the squaring mechanism built into the variance formula, turning a moderately unusual value into a dramatically larger squared contribution.
This sensitivity means identifying and understanding any outlier effect becomes essential before drawing conclusions from an unexpectedly high variance result.
How Does a Wide Range of Values Affect the Final Result?
A dataset spanning a genuinely wide data range, from very small to very large values, naturally produces higher variance than one confined to a narrow band of similar numbers.
This relationship makes sense intuitively: more spread between minimum and maximum values generally translates into larger average squared deviations from the calculated mean.
Can a Large Variance Be Caused by Different Groups Within One Dataset?
Yes, combining genuinely distinct subgroups, like measurements from two different populations, often produces artificially inflated variance compared to examining each group separately.
Investigating whether your dataset variation stems from combined groups, rather than genuine randomness, often reveals a more meaningful explanation than treating the data as one uniform set.
How Does the Distance From the Mean Influence Squared Deviations?
Every unit of distance from the mean contributes exponentially, not linearly, to the final squared deviation, since squaring a larger number produces a disproportionately bigger result.
This mathematical relationship explains why moderate outliers can dramatically affect variance even when most other values remain reasonably close to the arithmetic mean.
Why Can Variance Become Large Even When Most Values Look Similar?
A small handful of significantly different values can dominate the overall variance calculation, even if the majority of your dataset actually clusters quite tightly together.
This scenario often surprises people examining their data visually, since a few distant points can outweigh dozens of closely grouped observations in the final calculated result.
How Can You Investigate an Unexpectedly High Variance?
Start by sorting your data and visually scanning for unusually distant values, checking whether these represent genuine measurements or potential recording errors worth correcting.
This variance investigation step often resolves confusion quickly, revealing either a legitimate explanation or an actual data entry mistake requiring correction before recalculating.
Should You Compare Variance Values Without Considering Their Units?
No, comparing variance across datasets measured in different units or scales produces meaningless results, since squared units don’t translate directly between different measurement contexts.
Always confirm comparable scales before drawing conclusions from a variance comparison, or convert to standard deviation for a more intuitive, same-scale comparison instead.
How Can Standard Deviation Make a Large Variance Easier to Interpret?
Taking the square root of variance produces standard deviation, expressed in the original measurement units, making an otherwise abstract large number considerably easier to interpret intuitively.
This conversion step often clarifies whether a variance genuinely seems concerning or simply reflects normal spread once translated back into familiar, original-scale units.
Conclusion
A large variance usually points to something real, whether outliers, wide natural spread, or mixed subgroups, rather than signaling a calculation mistake. Investigating your actual data values, rather than just the final number, reveals whether that large result deserves concern or simply reflects genuine, explainable data dispersion.